

Summary
Focus Investing: Concentrate on 5–10 high-conviction stocks instead of spreading across too many names.
Probability Framework: Assign Bull / Base / Bear probabilities and update them as new information comes in.
Expected Value Signal: Use EV-to-Price ratio to judge whether to buy aggressively, buy moderately, hold, or sell.
Dynamic Position Sizing: Allocate based on bear-case probability — lower risk = higher allocation.
Trim & Rebalance: Adjust position sizes when they exceed your calculated threshold.
Recently, I read this book: The Warren Buffett Way, 3rd Edition by Robert G. Hagstorm and learned one interesting idea around portfolio management. I’m thinking about trying it.
The book talks about the idea of focus investing and how one should use probabilities to remove unknowns and act where the odds are best. What does this mean?
Basically, I should increase my position when I’m confident that a stock in my portfolio is only facing short-term headwinds, the underlying business fundamentals remains solid, and there are more bullish signals than bearish ones.
Problem is, how should I quantify these using probabilities? I asked ChatGPT (I had to… hahaha!) but before going further into the mechanics, I’d like to state some assumptions made:
This is a portfolio management method. This means it should apply to stocks that are already in my portfolio
Thus, I should know its current intrinsic value for both bull and bear cases
With the above assumptions cleared, here’s what I learned:
#1: ⚖️Decide on position sizing
Focus investing means I should only focus on few stocks (5 to 10) where businesses I understand the most instead of having 50 stocks.
Divide these holdings with equal percentage of capital allocations. For example, if my starting capital is $50,000 and I plan to only manage 5 stocks in my portfolio, then each stock will be allocated with $10,000.
The allocation size will be adjusted accordingly based on the probabilities of the stock (explained in later steps). Simple.
#2: 🎲Determine the base-case probabilities
This is basically a starting point where I should assign what is the probability for bear, neutral and bull case scenario. The total of each scenario should equal 100. Different sector or business type can have very different sets of base-case probabilities. Why?
This is because each sector or business has different qualities. Financial data software companies like FactSet (FDS) typically has highly recurring revenue. Its sticky enterprise workflows provide them with moderate pricing power. So, its base-case probabilities can be as follows (a rough estimates):
🟡Base = 55 (neutral), this refers to how the stock should perform normally. For FDS, its sticky enterprise workflow will provide them with steady financial performance but slow growth in earnings.
🟢Bull = 25, this refers to how likely the stock will perform out of its norm (base). For FDS, the implementation of AI could drive more new customers sign-up and also higher spending from existing customers.
🔴Bear = 20, this refers to how likely the stock will under-perform its norm (base). For FDS, there are competition coming from various AI platform that can scrape financial data but its sticky enterprise workflow and institutional fund’s demand for high quality data will likely prevent its existing customers from cancelling their subscriptions.
#3: 🎰Adjust the base-case probabilities
The base-case probabilities described above are just a starting point. As the company releases more announcement such as earnings that talks about their business performance and outlook, I should adjust it accordingly.
This means I should constantly lookout for any bullish or bearish signals and +/- the probabilities determined in step #2. Keep in mind that the total of these probabilities should always equal to 100.
For example, FDS’ bull and bear signals are as follows:

With these, all 3 scenarios will get adjusted by subtracting from the base and +/ - into the bull and bear case. Here’s the updated probabilities:
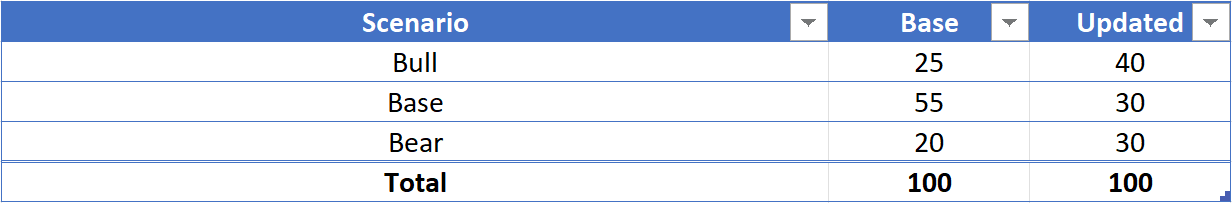
Noticed that I have subtracted a total of 25 points from the base scenario because that is the total points from the signals noted above. Thereafter, I add 15 and 10 points respectively into bull and bear case.
I’m oversimplifying here since it’s just a concept. I’ll refine this further once implemented.
#4: 📊Calculate the Expected Value (EV)
With the adjusted base-case probabilities determined, I can then compute the expected value by doing a weighted average of the three outcomes. Below is the formula:
EV = (P_Bull x IV_Bull) + (P_Bear x IV_Bear) + (P_Base x IV_Base)
Where;
P_Bull/ Bear/ Base = Probability of Bull/ Bear/ Base case
IV_Bull/ Bear/ Base = Intrinsic value of Bull/ Bear/ Base case
Using FDS as an example again, I need to have 3 intrinsic value. One for each scenario (e.g. bull, bear and base). If you read my book on dividend investing, I’d like to use relative valuation.
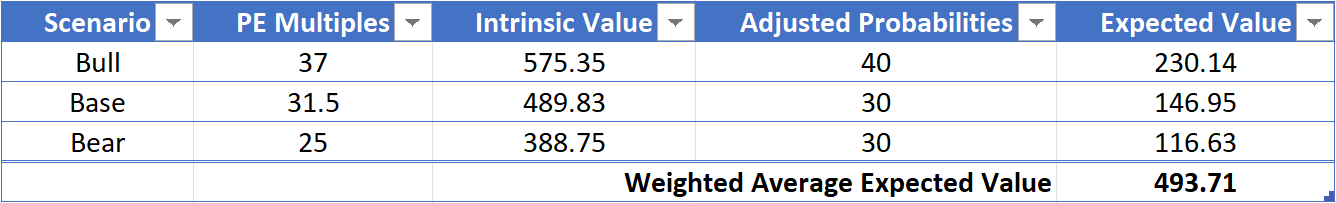
For FDS, its 10-yr average PE is at 31.5x and I can use this as the IV for base scenario. For me to identify the IV for both bull and bear, I just need to use standard deviation on the 10-yr PE trends.
This means the IV for bull should be the +1 SD which is 37x while the IV for bear should be -1 SD which is 25x. Below is the calculated EV:
#5: 🚦Translate EV into Buying Signal
My next step is how should I interpret this EV? Because it does not tell me if I should buy aggressively, buy moderately, hold or sell.
ChatGPT suggested that I should establish some Rule-of-Thumb based on the ratio of EV and the current share price. Below is the suggested rule bands:
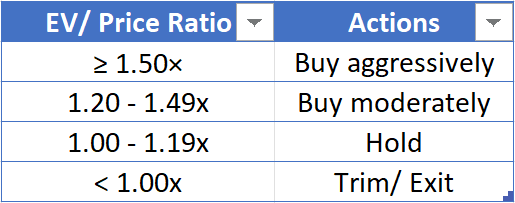
At the time of writing this journal, FDS’s EV-to-Price ratio is at 1.78x which suggests that I should buy aggressively.
#6: ⚖️Adjust Position Size
The next question is how much should I buy? In step #1, I established that my max allocation size per stock is $10,000 because I want to hold 5 stocks with the starting capital of just $50,000. This means 20% allocation per stock.
ChatGPT suggested below formula to determine the % I should allocate per stock based on the probabilities determined above:
Position Size = Max Allocation Size x (1 - Bear Case Probability)
Using FDS as an example, the % of capital I should allocate to buy this stock is 14%. This is because:
20% x (1 - 0.3) = 14%
Where;
20% = max allocation size per stock
0.3 = bear case probability for FDS
This kind of makes sense. The lower the bear case probability, the higher my allocation would be. Also, this strategy is conservative as it takes into account of the bear cases and does not allow me to max out the 20% allocation.
One of my principles is “never go all-in” because I might not have enough ammo to take advantage when there is a market downturn.
#7: ✂️When to Sell/ Exit?
With the allocation size established, it’ll now be easier for me to determine when should I trim or exit my position. This allocation size will become the threshold and it will be adjusted either quarterly or annually.
As long as the stock in my portfolio exit the threshold, I will start trimming or exit. For example, if FDS position in my portfolio reaches the max allocation size of 20%, I should trim it down to 14%. This is because the 14% is my ideal allocation size as calculated in Step #6.
If FDS has new bullish or bearish signals, I will update the bull, bear & base probabilities and recalculate the allocation size. From here, I will be able to determine whether I should add, trim or exit my position.
Conclusion
This is an interesting approach to portfolio management. It requires a lot of work to constantly monitor below items:
Bullish and bearish news of each stock currently owned
Bull, bear and base case probabilities
Position size adjustments
I’m thinking whether these can be automated by building an AI agent to help with some of these items.
I’ll try implementing this method manually while thinking of a way to automate this. That’s all for now, thanks for reading up to here. On to the next one…🙂
Disclaimer:
The information provided in this blog post is for informational purposes only and should NOT be construed as financial advice. Investing in stocks and ETFs involves risk, and there is no guarantee of profits. Past performance is not indicative of future results. It is important to conduct thorough research or consult with a qualified financial advisor before making any investment decisions. The author is NOT a financial advisor and is sharing his personal experiences and opinions only.
Additionally, please note that the author holds position in the discussed stocks, and his view may be biased as a result.